Salespeople are often the main face presented to the customer and own the client relationship, so it makes sense to ensure they are well armed with information that’s right for them. In many businesses, sales teams can also represent a large percentage of the total analytics user base. For these two reasons alone, meeting the needs of the sales team - including sales management and representatives - will go a long way to ensuring the success of an analytics initiative.
At Inside Info, we recently held a roundtable to discuss the information needs of sales teams, attended by a mix of sales leaders and analytics professionals. While there are multiple ways to try and categorise sales-related information, our experience is that three broad categories of sales analytics are most common.
Market Analysis
Analysis of the market is typically performed by Senior Management, Sales Management, Business Managers, Business Planners and Marketing Managers. It starts at a high level and looks outside the organisation at macro factors driving the market. Key questions answered include: What’s going on in the market? Is it growing? What is our market share? What are the trends – which product categories and products are growing, which are shrinking and at what rates? Which territories and markets are growing? Which are contracting?
The aim here is to get a good understanding of the market situation that will help in both planning and resource allocation, as well as measuring performance against these targets. Analytics performs a vital role at this level because it helps organisations understand the big picture of what’s going on before looking at specifics inside the organisation, at a more day-to-day level, that are under their management. It helps ensure sales teams are focusing their efforts on the right markets, the right territories and the right product or service segments.
Customer Analysis
Most organisations will generate the majority of their revenue from existing clients, so having intimate knowledge of what is going on within your customer base is essential. This means analysing and asking key questions such as: Who are our top 10 customers? What is our profitability by client? Which customers are active and which are not in my territory? What are they buying? Are they doing more or less with us? Are there any trends in their behaviour? What are they doing compared to what’s happening in similar clients? The broader market? What cross-sell, up-sell opportunities are there? What are the forecast sales? What activities have we done with this customer in the last six months? Should we be performing more or less activity on particular clients?
In any organisation with say 100+ customers, detailed customer sales analytics will uncover opportunities and threats within the customer base, allowing actions to be prioritised to maximise relationships and return.
Sales Team Performance
Sales by nature is a performance-based role. It is black and white, whether or not numbers are being reached. Analytics plays a big role in embedding a performance based culture within an organisation, making performance by individuals and teams visible and transparent. Sales performance analytics will answer such questions as: How is my team going? How are we going compared to budget? Compared to other teams? Who’s doing well - the sales ladders? Why? Who’s not doing well? Why? How am I performing versus the budget? What’s your forecast? What stage in the pipeline are each of your opportunities? What is our total weighted forecast sales?
From the roundtable discussion, and consistent with our experience, there is often an overlap between these areas. A discussion about performance of a sales rep will often then lead into a discussion about the customer to determine how performance can be improved. Or a discussion about the market will move into a discussion about how we will achieve a set target across customer segments.
It is important to organise and present the data based on the perspectives the organisation decides to emphasise. For example, one organisation had always led with information on sales rep performance first. Strategically, they decided they wanted the reps to first look at information from the customer perspective – information on what is happening in their territory and with their customers. So they organised data views on the rep dashboard to show specific KPIs on their customer – such as ranking customers based on sales or the number of face-to-face meetings that have occurred.
Some other key learnings and observations:
- Make the dashboards and analytics visually engaging; this will help drive adoption. All people, in particular salespeople, like something that looks fresh and new.
- It needs to be simple. Sales teams are not data scientists, and people within sales teams change regularly. Analytics needs to be simple enough for the average salesperson to pick up without lots of training.
- Training should focus mainly on what behaviours and actions the sales leaders want from the reps in using the analytics. What are we going to do differently now that we have this information?
- Ensure the right amount of information is provided – just enough for reps to do their job and make the decisions, and no more. This includes all performance information in the one place from multiple sources (e.g. sales, CRM, market share), creating a single view of the customer.
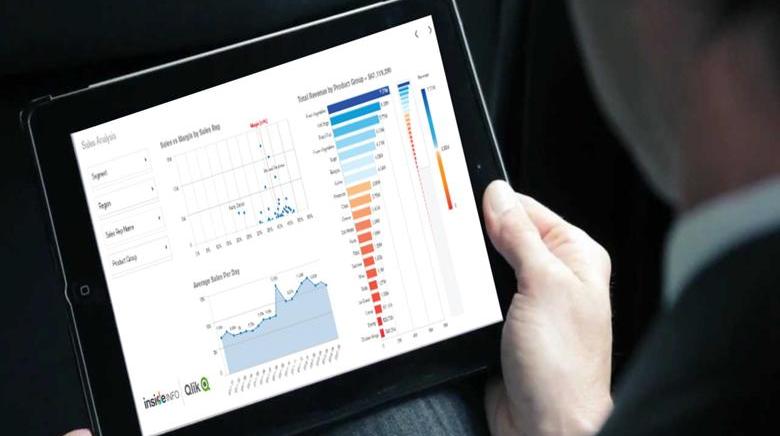
- Consider the device they use and tailor the information to that device; for example, if sales reps use iPads, design the analytics on an iPad.
In a competitive environment, a sales rep being better prepared and informed on what is going on with the client can be the make or break in winning a deal and extending a relationship. Business analytics - when done well - can not only make the sales team more efficient, but also more informed and more prepared. It will drive not only a closer customer relationship, but also a more engaged and satisfied sales team.


