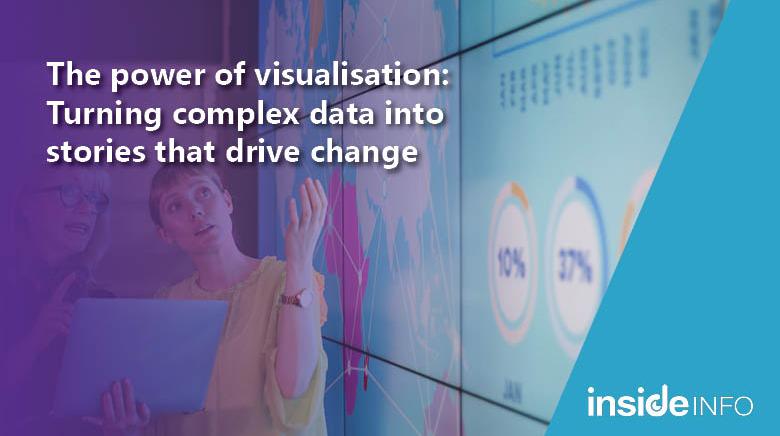
We are inundated with vast amounts of information, every day, making it difficult to extract what truly matters. Data visualisation helps by converting complex datasets into clear, compelling visuals, enabling businesses to uncover patterns, make informed decisions, and drive change across teams.
Why data visualisation matters
Studies have shown that 90% of the information processed by the brain is visual, and people remember visual data 65% better than text alone (Source: MIT). When data is presented visually, it becomes more accessible and digestible, enabling faster and more effective decision-making.
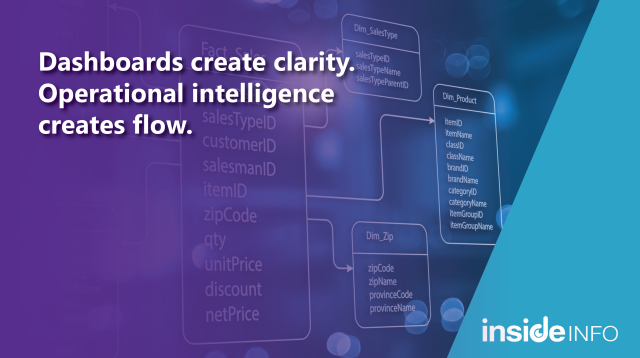
Without visualisation, organisations risk losing critical insights in spreadsheets or static reports. Instead of sifting through rows and columns of numbers, stakeholders need interactive and dynamic representations of data that highlight key trends and correlations.
Qlik: Transforming data into actionable stories
Qlik empowers organisations by transforming raw data into intuitive and interactive visualisations that make information accessible to all stakeholders. Unlike traditional dashboards that present static charts, Qlik’s dynamic visualisation capabilities enable users to explore data from multiple angles, ask deeper questions, and uncover hidden opportunities.
Some of the key benefits of Qlik’s data visualisation include:
- Enhanced accessibility: From executives to frontline employees, visual storytelling ensures that insights are understood and leveraged at every level of an organisation.
- Real-time decision making: Interactive dashboards enable users to make data-driven decisions, quickly.
- Simplified complexity: Advanced analytics are presented in a way that is easy to interpret, eliminating reliance on data specialists.
Visual storytelling in action: Driving impactful business decisions
Data storytelling is not just about presenting numbers; it’s about crafting a narrative that compels action. Here are a few real-world examples of how businesses have leveraged visualisation to drive change:
- Retail performance optimisation: A multinational retailer used Qlik’s visual dashboards to track sales trends across regions. By identifying underperforming stores in real-time, leadership was able to adjust pricing and promotional strategies, resulting in a 12% revenue uplift.
- Healthcare efficiency improvements: A hospital system leveraged Qlik to visualise patient flow and bottlenecks in emergency rooms. By addressing inefficiencies, patient wait times were reduced by 30%.
- Financial risk management: A financial services firm utilised Qlik to map fraudulent transactions, identifying patterns that led to an 18% reduction in financial losses due to fraud.
Inspiring cross-department collaboration
When insights are visually engaging and easy to interpret, departments can align on objectives and make unified strategic decisions. Qlik’s dashboards help break down silos by offering a shared view of key metrics, enabling marketing, finance, operations, and IT teams to work towards common goals with a single source of truth.
Turning Insights into Action
When organisations harness the power of visualisation, they move beyond data collection to data-driven action. With Qlik, businesses can move past static reports and use interactive visual storytelling to drive decisions and achieve strategic goals.
As organisations continue to navigate a rapidly evolving business landscape, the ability to see, understand, and act on insights will be the defining factor in achieving sustainable growth.
Are you ready to transform your data into stories that drive change? Contact us to see how Qlik’s powerful visualisation tools can bring your data to life.