Inside Info has an extensive history working with mid-sized and large manufacturing and distribution businesses to improve performance through better use of business analytics. In fact global packaging leader Amcor (now known as Orora) chose Inside Info as their BI partner across Australasia which was leading the charge globally to improve profit, sales and marketing excellence. We delivered interactive dashboards showing plant, customer and product level profitability and supply chain analysis across the business using Qlik on top of SAP BW, designed and delivered to over 500 employees initially, in just 25 work days. Costs were allocated back to invoice line and ship to level for over 1 million SKU's. IT analysts Gartner selected this peice of work as the only Australian finalist in their Asia Pacific BI Excellence Awards at the time. It was estimated that this project delivered an increase in Amcor's gross profit margin by 1% or over $70 million in the first year alone.
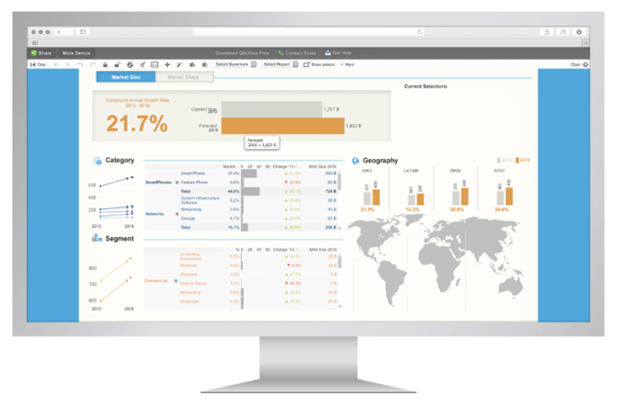
A One-Screen View Of All The Facts
Ensuring cross functional visibility, integrating customer, financial and operational data for a clear view of sales, inventory, service levels, customers, financial and other operational performance.
Easy Monitoring Of Service Levels For Supply Chain Efficiencies
Monitoring and analysing outbound service levels such as Delivery In Full On Time (DIFOT), by product, customer, location and order, can lend amazing insight into suppliers, account servicing, operational issues and dynamics. You should know who you're servicing, what it's costing and how this relates to what they contribute to the business. Most companies know their DIFOT percentage but the key is being able to easily pinpoint why and what the issues are. Distributors traditionally have thin margins as the middleman in the supply chain, so effectively managing supply chain efficiencies in a dymanic operating environment is critical.
Interactive Analysis Of Inventory
See the stock you are carrying, analyse inventory for vendor, material, warehouse, region and other perspectives. Understand inventory investment and how it's distributed. Measure overstocks, understocks, inventory aging, downtime and failure rates. Clearly understand stock KPI's like inventory turns or month's stock at a high level with the ability to drill down to specific items in specific locations.
Production Analysis
Measure and monitor plant utilisation, overall equipment efficiency, manage labour, material and overhead costs, inputs, cycle and order times with a view to manage asset infrastructure more effectively. While keeping track of other key measures of performance like risk and safety with a view to synchronise operational processes using real-time production insights to maximise asset efficiency.
Proactive Demand Planning
Determine whether your stock levels and fluctuations let you meet customer demand, especially if you have long lead times for stock replenishment. Know not just when you're out of stock, but when it's likely in the future, allowing preventative action to be put in place.
Procurement Analysis
To keep expenses and costs in check, analyse vendor performance, demand and purchasing power. Monitor expenditure across the business while also ensuring compliance with supplier contracts.
360 Degree View Of Customer Behaviour
Understand customer behaviour and buying patterns and thow that drives cost, efficiency and resource utilisation. For example, do the same people order every day or once per week, what products or components are they ordering and how does this align to servicing.
Warehouse Efficiency
Understand your picking and packing rates and be able to tie customer service issues back to activities.
Interactive Financial & Profitability Analysis
Tracking P&L views from the enterprise or individual cost centres, providing dashboard style profitability analysis across any area of the business including by project, customer, region or division. Inside Info can utilise a number of advanced analytics techniques here like tail analysis that plots cumulative profit for each product so it's easy to see where the business is making or losing money. Waterfall analysis can benchmark costs in each division versus the Group to see how to improve profitability through product re-engineering, selling other products or servicing the client in a different way.
Near Real-Time Visibility Into Operations
Instead of out-of-date reports, on-demand self-serve or guided analysis of data can often replace hundreds of OLAP reports, empowering business users and freeing up IT. Qlik can provide sub-second response on very large data sets into the hundreds of millions of records without losing transactional level detail, with data refreshing as often as your underlying source systems. All our BI solutions have the ability to easily conslidate data from any and multiple data sources (ERP, freight, data warehouse, production, CRM, Financial, HR, spreadsheet, online, etc.).


CASE STUDY
Inside Info's journey with Manassen Foods delivering a consolidated view of performance across multiple businesses, leveraging Qlik & Infor M3.
Inside Info has supported us since the beginning of our journey with QlikView. Their services and advice are always exceptional, while demonstrating a continued investment in the relationship even after many years.
Sandy Antonuccio, GM IT Applications ANZ, Orora
Seeing Is Achieving
The best way to learn about how we can assist you in improving your analytics and reporting is to see our solutions in action. Contact us to book a personalised session with our consulting team.