

Whitepaper: 3rd-Generation Business Intelligence
Discover how the 3rd generation of BI spreads analytics to every corner of your business, finally giving all your users the power to make discoveries that ignite transformation.
Using Descriptive, Predictive & Prescriptive Analytics For Impact
By on Feb 11, 2019
With the flood of data available to businesses and with the constantly evolving business intelligence and analytics landscape, it can be daunting to understand what type of analytics solution you should be using and for what task. No one type of analytics is better than another, in fact they co-exist with, and complement each other. In order for a business to have a holistic view of the market and how they compete efficiently within the market, requires a robust analytic environment which includes:
- Descriptive Analytics, which uses data aggregation and data mining to provide insight into the past and answer: “What has happened?”
- Predictive Analytics, which uses statistical models and forecasting techniques to understand the future and answer: “What could happen?”
- Prescriptive Analytics, which uses optimisation and simulation algorithms to advise on possible outcomes and answer: “What should we do?”
To this end, we'll briefly explain the difference between the three main types of analytics solutions; Descriptive, Predictive and Prescriptive Analytics and when to select one over the other.
Descriptive Analytics - Insights Into The Past
Descriptive analysis does exactly what the name implies, it “Describes”, or summarises raw data from the past and provides insights based on this data from which to make business decisions. This can be from data captured one minute ago, or one year ago. Descriptive analytics provides an accurate view to learn from past behaviours, and understand how they might influence future outcomes. The vast majority of analytics we use fall into this category. Usually, the underlying data can be from any and multiple business systems, structured or unstructured like Big Data. It is a count, or aggregate of a filtered column of data to which basic math is applied. Businesses use Descriptive Analytics when they need to understand at an aggregate level what is going on in the business, and when they want to summarise and describe different aspects of the business. Descriptive statistics are useful to show things like, total stock in inventory, average dollars spent per customer and Year over year change in sales. Common examples of descriptive analytics are reports that provide historical insights regarding the company’s production, financials, operations, sales, finance, supply chain, inventory and customers.
Predictive Analytics - Forecasting Future Outcomes
Predictive analytics is about having the ability to “Predict” what might happen, providing estimates about the likelihood of a future outcome, to better prepare for future business scenarios. It is important to remember that no statistical algorithm can “predict” the future with 100% certainty. Companies use these statistics to forecast what might happen in the future based on probabilities. These statistics try to take the data that you have, and fill in the missing data with best guesses. They combine historical data found in systems like an ERP, CRM, HR and POS system to identify patterns in the data and apply statistical models and algorithms to capture relationships between various data sets. Predictive analytics can be used throughout the organisation, from forecasting customer behaviour and purchasing patterns to identifying trends in sales activities. They also help forecast demand for inputs from the supply chain, operations and inventory.
One common application most people are familiar with is the use of predictive analytics to produce a credit score. These scores are used by financial services to determine the probability of customers making future credit payments on time. Typical business uses include, understanding how sales might close at the end of the year, predicting what items customers will purchase together, or forecasting inventory levels based upon a myriad of variables.
Prescriptive Analytics - Advise On Possible Outcomes
The relatively new field of prescriptive analytics allows users to “prescribe” a number of different possible actions to and guide them towards a solution. In a nut-shell, these analytics are all about providing advice. Prescriptive analytics attempts to quantify the effect of future decisions in order to advise on possible outcomes before the decisions are actually made. At their best, prescriptive analytics predicts not only what will happen, but also why it will happen providing recommendations regarding actions that will take advantage of the predictions.
These analytics go beyond descriptive and predictive analytics by recommending one or more possible courses of action. Essentially they predict multiple futures and allow companies to assess a number of possible outcomes based upon their actions. Prescriptive analytics use a combination of techniques and tools such as business rules, algorithms, machine learning and computational modelling procedures. Artificial Intelligence or AI falls into this category. These techniques are applied against input from many different data sets including historical and transactional data, real-time data feeds, and big data.
Prescriptive analytics is relatively complex to administer, and most companies are not yet using them in their daily course of business. When used correctly, they can have a large impact on how businesses make decisions, and on the company’s bottom line. Larger companies are successfully using prescriptive analytics to optimise production, scheduling and inventory in the supply chain to make sure that are delivering the right products at the right time and optimising the customer experience. To make the most of Prescriptive analytics tools, ensure there is a way to see what action is being recommended and why as common sense may need to be applied.
Inside Info works with both the leading Qlik BI platform to deliver these capabilities to clients. Working hand in hand, all three categories of analytics play a part in providing guidance and the intelligence to optimise business performance, as one feeds the other. The more descriptive data you have at your disposal the better, as it provides a richer foundation to feed automation and forecasts.

Sonia Johnson
Sonia Johnson heads Inside Info's Marketing team, as an experienced B2B marketer, having launched and built the Qlik brand in the Australian market. Sonia has 20 years' experience working within the IT and telco industries, having worked for IBM and Vodafone, the last ten years have been focused within the business intelligence and corporate performance management sectors.
Related Articles
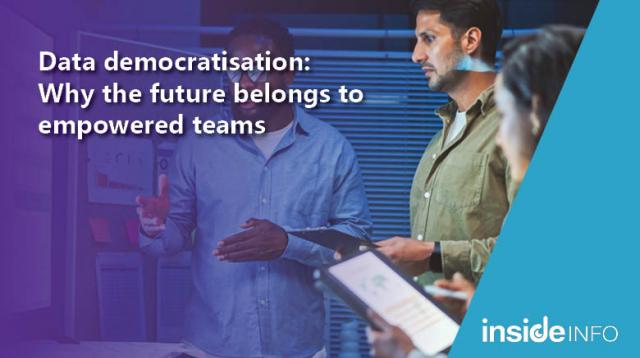
The future belongs to businesses that empower their teams with data tools that are easy to use, intuitive, and accessible - regardless of technical expertise.
By
on Jun 20, 2025
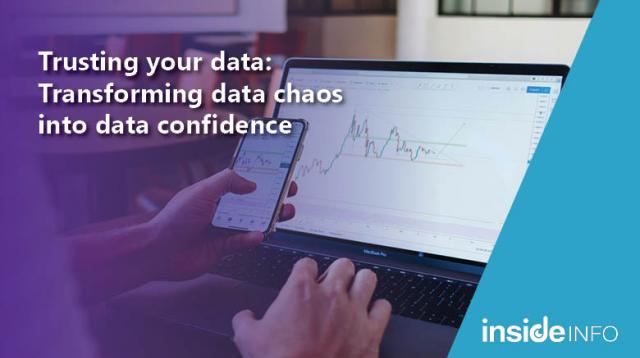
Trust in data is not just about ensuring numbers line up, it’s about creating a foundation where leaders can confidently rely on data to forecast trends, develop strategies and make predictions that drive future success.
By
on Feb 12, 2025