Qlik Business Intelligence and Analytics

Qlik Acquisitions Expand Leadership in Analytics With AI, Data Management and Machine Learning

Qlik Acquisitions Expands Leadership in Analytics, AI, Data Management and Machine Learning

Qlik have been busy making a number of product enhancements and acquisitions lately to support Qlik's strategy of strenghthening and offering an end-to-end data management & Business Intelligence (BI) platform. Here we explain the value of these acquisitions and Qlik's move into Augmented Intelligence (AI) and Machine Learning (ML).

The Introduction of Insight Advisor - Qlik's AI Capability

Qlik is applying a unique approach to Artificial Intelligence (AI), which bridges AI and cognitive technologies with its UX and core Associative Engine to deliver what Qlik describes as Smart Start capabilities across the entire product portfolio. Smart Start features take advantage of the new cognitive insight engine in Qlik Sense®, which works with the Qlik Associative Engine to provide context-aware insights and automations across the analytics life-cycle. Taking this approach allows Qlik to combine machine intelligence with human intuition in new and powerful ways that unlock tremendous value for users and organisations.

According to Gartner, Inc., “A new paradigm — augmented analytics — is rapidly gaining traction. Central to this development is the use of ML automation/AI techniques to augment human intelligence and contextual awareness, and to transform data management, analytics and BI as well as many aspects of data science and ML/AI model development and consumption.”*

Insight Advisor debuted as part of the June 2018 Qlik Sense Enterprise release.  Insight Advisor auto-generates and suggests the best analytics and insights to explore based on the overall data set and a user’s search criteria, making insight suggestions increasingly relevant and valuable. This was further enhanced with the November 2018 release of Qlik Sense®, where Qlik introduced new machine learning capabilities into its cognitive engine and platform as part of Insight Advisor. Precedent-based machine learning allows the Qlik cognitive engine to get smarter over time, continually learning from user interaction and feedback as well as other sources. Qlik is the first analytics company to bring AI and ML capabilities together with human intuition in a way that truly augments the user’s power to discover. Users can directly train the machine by manually creating analytics, altering what the machine suggests, and providing direct feedback. The cognitive engine also learns from additional governed and trusted sources such as business rule definitions in global libraries and Qlik artifacts.

Because the associative engine is aware of a user’s context (selection state) at each step in the exploratory process and knows all the data that is associated and unrelated to that context, this is factored into machine driven analysis and insight suggestions to make them more relevant. It’s like giving the user “peripheral vision” that guides them to hidden insights and helps them see the previously unseen.

Watch Insight Advisor Video

Qlik's Move Into Conversational Analytics

A month ago, Qlik announced its acquisition of CrunchBot and Curnch Data to expand its augmented intelligence and cognitive capabilities in the area of conversational analytics.  CrunchBot works uniquely with Qlik As a Trusted Extension Developer (TED) accredited solution, validated by Qlik for quality and functionality and built upon Qlik’s open API framework and Associative Engine.  CrunchBot enables users to:

  • Ask questions in a conversational manner through the Qlik Sense UI or popular collaboration tools such as Slack, Skype, Salesforce Chat and Microsoft Teams;
  • Explore and ask questions of their data through voice interaction with integration to services such as Amazon Alexa;
  • Receive robust answers and insights including additional context with auto-generated charts, interpretations, key drivers, period-over-period calculations and predictions for measures;
  • Seamlessly dive directly into Qlik Sense analytics apps based on the results, with the context (selection state) retained;
  • Leverage unique Natural Language Processing (NLP), which automatically trains itself and tracks user inquiries over time, and Natural Language Generation (NLG) which delivers insights for not only what is happening, but also why – and where to go next. 

CrunchBot is immediately available to customers through Qlik today, and will be licensed as a value-added solution to the Qlik Sense platform. To be named the Qlik Insight Bot, this new product will be available alongside Qlik’s existing Insight Advisor capability and will be further integrated with the Qlik cognitive engine to deliver value to its customers. Here's an article we wrote recently about Conversational Analytics.

Watch CrunchBot Video

Acquisitions For Improved Data Integration & Enterprise Data Management

Podium Data - aka Qlik Data Catalyst

Last year Qlik announced its acquisition of Podium Data, an enterprise-grade data management company whose solution simplifies and accelerates customers’ ability to manage, prepare and deliver analytics-ready data to every business user across a diverse data landscape. Enterprise data strategies have evolved to rely heavily on the creation of data lakes, however businesses are realising that these and other data sources aren’t designed to easily and quickly deliver data to the business user. In many instances, data lakes have only increased customer data complexity and management headaches. According to Gartner Inc., “Through 2018, 90% of deployed data lakes will be rendered useless, as they’re overwhelmed with information assets captured for uncertain use cases.” (Gartner. Derive Value From Data Lakes Using Analytics Design Patterns. 26 September 2017).

With Podium Data, Qlik provides customers with an expanding enterprise data management solution to transform their raw data into a governed, analytics-aware information resource. Qlik have re-branded this capability to be called Qlik Data Catalyst - a data management solution that simplifies & speeds up how you catalogue, manage, prepare & deliver trustworthy data. Qlik's Data Catalyst builds a secure, enterprise-scale repository of all the data your business has available for analytics, giving your data consumers a single, go-to catalogue to find, understand and gain insights from any underlying data source. The solution's data preparation and metadata tools streamline the transformation of raw data into analytics-ready assets, while the product's Smart Data Catalogue and graphical user interface help people easily discover and select whatever data they need. Built on a platform of hardened data security and featuring governance capabilities, you can easily integrate Qlik Data Catalyst with any of your other data management tools. Qlik Data Catalyst provides:

  • Intelligent Data Profiling and Onboarding: Ability to profile and register data from any source or location throughout the organisation, providing a comprehensive understanding of every data element, with applied pattern matching, rules based metadata enrichment, and auto obfuscation rules to protect sensitive data.
  • Automated Data Quality: Inspecting, improving and documenting the quality of incoming data through validation, formatting and encryption.
  • Data Preparation and Publishing: Enriching and transforming data without additional programming, with the ability to publish data to downstream systems and be consumed by a broad base of users, including data scientists, analysts and business intelligence users.
  • Smart Data Catalogue: A searchable data catalogue organised with tags, business definitions and data lineage that makes it fast and easy for business users to find, understand and “shop” for data.

Data Catalyst 4.0 released in January this year further broadens support for data sources beyond Hadoop to further unify enterprise data managemetn wherever data resides.  

Watch Qlik Data Catalyst Video


Attunity

Building on Qlik’s recent acquisition of Podium Data and the introduction of Qlik Data Catalyst, Qlik announced just a few days ago, its intention to acquire Attunity for its market leading data integration & big data management capabilities. Attunity provides cross-platform data streaming capabilities to support a shift to cloud and real-time analytics. This acquisition further differentiates Qlik by providing an expanded breadth of enterprise data management capabilities and will enable real time data delivery across complex cloud environments.


*Gartner: Augmented Analytics Is the Future of Data and Analytics, 31 October 2018 - ID G00375087

The Dawn Of Post Modern Analytics

In this ebook Qlik outline their view on the Top Ten Business Intelligence Trends for 2019. In a world where information is power, we need postmodern analytics – analytics that decentralises data ownership and delivers high performance that easily scales to the masses. In 2019, we'll see this begin to emerge, as the technology shifts toward making data accessible to all people and all organisations. The following are the 10 virtues of a postmodern analytics platform:

Emerging BI Trends For 2019

Qlik's BI Trends for 2019

With the rising complexity of the business intelligence environment, the identification of trends and market developments is a key factor in effective decision making.  It’s also increasingly important to use the latest technologies and approaches in order to cope with digitalisation and market competition. 

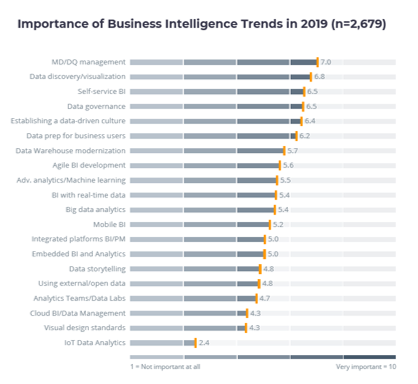
According to BARC’s 2019 BI Trend Monitor which surveys over 2,679 BI users, consultants and vendors globally, the three most important trends remained the same as last year with master data and data quality management in first position, data discovery in second and self-service BI in third, while data governance and establishing a data-driven culture were ranked next, mainly fueled by the need to address rules around data introduced in 2018 with the General Data Protection Regulation (GDPR). 

While master data and data quality management builds a strong foundation for handling data, the significance attached to data discovery and self-service BI shows that the empowerment of business users is a consistently strong trend.

The lack of interest in IoT analytics, which features in last place in BARC’s BI Trend Monitor, leads to the assumption that businesses are neither prepared nor really focused on implementing this special kind of analytics at the moment.

Trends that have clearly increased in importance compared to last year include agile BI development and advanced analytics and analytics teams. While agile BI development is connected to a revolutionised cooperative approach between lines of business and IT, advanced analytics expresses the need for businesses to use data in a more beneficial way. Also, advanced analytics includes machine learning, which is tightly interconnected to many hyped use cases in the sphere of artificial intelligence.

Qlik's Top 10 BI Trends For 2019

Business analytics leaders Qlik have compiled their own 10 virtues of a post modern analytics platform kicking us off in 2019, ranking their top BI Trends for the year, which are highlighted below:

1. Multi-cloud, hybrid and edge will form a continuum

In 2019 platforms will emerge that can handle multi-cloud, hybrid and edge as a continuum rather than as separate efforts. Around 10% of enterprise-generated data is created and processed outside a traditional centralised data centre or cloud. By 2022, Gartner predicts this will reach 75%.

2. Workloads - not just data - will be distributed 

In 2019 the majority of enterprise architects at leading organisations will view microservices and container-orchestration as critical architectural components of BI and analytics platforms. IDC actually predict that by 2022, 90% of all new apps will feature microservices architectures that improve the ability to design, debug, update and leverage third party code. 

3. Centralised data will be replaced by a single view of all data 

In 2019, focus will shift from bringing all data together into one place to getting a single view of all data. Gartner predict that by 2020, most D&A use cases will require connecting to distributed data sources, with leading enterprises to double their investments in metadata management. 

4. Analytics embedded in the process will reshape the process 

In 2019, analytics will be more pervasive in the process.  Users want analytics in their existing workflows to make insights more actionable and in real-time. This forms the basis of “continuous analytics” in which real-time analytics will be integrated within a business operation or IoT, processing data to prescribe actions in response to business moments. 

5. External innovation will outpace internal innovation by 2X

In 2019, the market will look to open APIs and extensions as a necessity, as innovation from open platforms with ecosystems will outpace those with only internal innovation by a factor of 2X. 

6. Performance and scale will re-take centre stage 

Performance of a BI platform can often be overlooked, but many self-service BI solutions crumble when it comes to time to scale to more data, bigger workloads and more users. As companies increase their adoption of hyperscale data centres and move into the IoT world, performance will rise in the selection criteria. 

7. AI will make analytics more human, not less 

In 2019 and beyond AI designed around people will have a higher impact than AI that takes people out of the process. According to Gartner, by 2020, augmented analytics will be a dominant driver of new purchases of BI. 

8. Visualisation, conversation and presentation technologies will merge 

In 2019, we’ll see a convergence among visual, conversational and presentation technologies, facilitating persuasive storytelling.  According to Gartner, by 2021, conversational analytics and natural language processing (NLP) will boost analytics and BI adoption from 32% of employees to over 50% of an organisation’s employees, to include new classes of users particularly in front offices. 

9. Data literacy will become a KPI

Enterprises will move to further create a culture of data literacy to drive operational improvement and decisions by making data literacy a KPI across the business that can be measured. 

10. Platforms will evolve into systems

Rather than having individuals use tools, groups of people and bots/intelligent agents will participate in systems. 

In a world where information is power each of us has a responsibility to stay informed and active, continuing to reach higher levels of performance and decision making through better use of enterprise data.  When we do that we build organisations that are increasingly competitive, self-organising and robust, thanks to a dynamic collective intelligence. If you’d like to read more about Qlik’s Top BI Trends For 2019 download the ebook below. 

Download Ebook

Why Enterprises Should Consider AI-Based Conversational Analytics

Conversational analytics and Qlik

For some time there has been a shift in the way people interact with brands and devices, through a conversation. With messaging apps outpacing social networks in terms of monthly active users — and with the rise of wearable devices and the Internet Of Things (IoT) — businesses are following their audience to provide conversational experiences through chatbots and voice-enabled applications alike.

This shift isn’t just changing the game for how we use devices and connect to brands. It’s changing the way we look at data, too. Conversational analytics is quickly becoming a primary need for businesses who want to get to know their audience and provide a better user experience. Specific benefits of conversation analysis include sentiment analysis, enhanced social listening and greater personalisation to better meet users’ needs.

What Is Conversational Analytics or Data?

First, what is conversational data? It’s data that helps you make sense of how users are interacting with your chatbot or any device with a conversational interface. Conversational data is most useful because it shows individual users’ interactions in real time; web analytics, on the other hand, aggregates overall traffic data and is tough to act on while any individual user is browsing a site.

With conversational analytics, for example, you can single out a target demographic or user to see what they’re talking to a bot or application or both, then view every step of the conversation as it’s happening. While web or app analytics might show you a bounce rate, conversational analytics shows you exactly what was last said that makes a user leave a chatbot or voice application. By keeping record of each and every interaction on an individual level, this data is essential for retaining users, improving applications and understanding your audience.

“By 2020, 50% of analytical queries will be generated via search, NLP or voice, or will be automatically generated”.1 

What can conversational analytics teach you about your audience? Quite a lot actually.  Data helps to segment your audience by identifying their interests and letting you act on it. A retail chatbot can learn what its users are most interested in — say, a 20-something young woman who lives in an urban environment and enjoys buying dresses. By assessing when she’s most active with the bot, the retailer can tailor to her tastes when she browses for a purchase. At other times, the retailer bot can push notifications related to her interests when she’s most likely to respond — in the same environment where she’s actively talking to her friends. With AI, this segmentation is automatic and dynamic in real time as the conversation evolves.

These metrics keep your users engaged and coming back for more. Using AI-based analytics, you can collate this information automatically, providing always-up-to-date reports on your audience activity in real time. Conversational UI is all about providing a personalised, custom experience, therefore, conversational analytics is rich in data that you need to know your users on an intimate, individual level.

Qlik's Move Into Conversational Analytics

Business intelligence leader, Qlik, just announced its acquisition of CrunchBot and Curnch Data to expand its augmented intelligence and cognitive capabilities in the area of conversational analytics.  CrunchBot works uniquely with Qlik As a Trusted Extension Developer (TED) accredited solution, validated by Qlik for quality and functionality and built upon Qlik’s open API framework and Associative Engine.  CrunchBot enables users to:

  • Ask questions in a conversational manner through the Qlik Sense UI or popular collaboration tools such as Slack, Skype, Salesforce Chat and Microsoft Teams;
  • Explore and ask questions of their data through voice interaction with integration to services such as Amazon Alexa;
  • Receive robust answers and insights including additional context with auto-generated charts, interpretations, key drivers, period-over-period calculations and predictions for measures;
  • Seamlessly dive directly into Qlik Sense analytics apps based on the results, with the context (selection state) retained;
  • Leverage unique Natural Language Processing (NLP), which automatically trains itself and tracks user inquiries over time, and Natural Language Generation (NLG) which delivers insights for not only what is happening, but also why – and where to go next. 

This move further builds upon Qlik's augmented intelligence and machine learning capabilities for enterprises. CrunchBot is immediately available to customers through Qlik today, and will be licensed as a value-added solution to the Qlik Sense platform. To be named the Qlik Insight Bot, this new product will be available alongside Qlik’s existing Insight Advisor capability and will be further integrated with the Qlik cognitive engine to deliver value to its customers.

With the November 2018 release of Qlik Sense®, Qlik introduced new machine learning (ML) capabilities into its cognitive engine and platform as part of Insight Advisor. Precedent-based machine learning allows the Qlik cognitive engine to get smarter over time, continually learning from user interaction and feedback as well as other sources. Qlik is the first analytics company to bring AI and ML capabilities together with human intuition in a way that truly augments the user’s power to discover. Insight Advisor auto-generates and suggests the best analytics and insights to explore based on the overall data set and a user’s search criteria, making insight suggestions increasingly relevant and valuable as the machine learns from the user’s analytics interactions. Users can directly train the machine by manually creating analytics, altering what the machine suggests, and providing direct feedback. The cognitive engine also learns from additional governed and trusted sources such as business rule definitions in global libraries and Qlik artifacts.

Qlik’s AI and ML capabilities are unique because they work directly with Qlik’s associative engine, combining the power of AI with human intuition. Because the associative engine is aware of a user’s context (selection state) at each step in the exploratory process and knows all the data that is associated and unrelated to that context, this is factored into machine driven analysis and insight suggestions to make them more relevant. It’s like giving the user “peripheral vision” that guides them to hidden insights and helps them see the previously unseen.


1 Gartner: Augmented Analytics Is the Future of Data and Analytics, 31 October 2018

Analyst Report: BARC’s BI Survey 18 – Qlik Highlights

BARC BI Survey 18 Qlik Results

BARC has just released the results of its BI Survey 18, the world's largest independant survey of BI users.  Qlik once again has been named a clear leader when it comes to ease of use, query performance, business value, customer satisfaction, visual analysis and many more.  The results this year in the report break down Qlik Sense and QlikView seperately and assess these two Qlik business analytics platforms. You can see the highlights results of each below.

Qlik Sense Highlights

  • KPI Results - 6 Top Rankings & 30 Leading Positions In 4 different peer groups
  • Recommendation - 98% of surveyed users would recommend Qlik Sense
  • Query Performance - 52% of surveyed users chose Qlik Sense for its fast query performance compared to 29% for the average BI tool. In fact for the 3rd year in a row Qlik Sense ranks 1st for query performance in the data-discovery peer group
  • Data Volume - 40% of surveyed users chose Qlik Sense because of its large data handling capacity compared to 19% for the average BI tool

QlikView Highlights

  • KPI Results - 18 Leading Positions in 3 different peer groups
  • Recommendation - 95% of surveyed users would recommend QlikView
  • Query Performance - 57% of surveyed users chose QlikView because of its fast query performance compared to 29% of the average BI tool
  • Understanding - 80% of surveyed users rate the ability of Qlik to understand their organisation's needs as good or very good
  • Support - 69% of surveyed users rate their implementer support from QlikView as good or excellent


Download The BI Survey 18 Report

Qlik Sense September 2018 Release Highlights


Just a quick update to share the news of advancements made to Qlik Sense with the September 2018 release.

Insight Advisor & Augmented Intelligence

Insight Advisor suggests the best analytics and insights to explore for users within a Qlik Sense application.  This level of augmented intelligence is extended in the Qlik Sense September 2018 release to all users of Qlik Sense Apps, including published apps in streams, to encourage further data exploration across the enterprise.

Advanced Authoring Capabilities

Building upon the Advanced Authoring capabilities delivered in June, this has been further advanced with the addition of high value features specific to building sophisticated data layouts, increasing the speed of application development and improving ease of use.  These include many QlikView like capabilities such as:

  • Better control over information density within the Qlik Sense client for devices that support touch and mouse input
  • Default bookmarks for setting initial selection state when applications are opened
  • The ability to turn off responsiveness of the client for custom sheet sizing
  • Expression Editor enhancements including direct links to help, restructured function categorisation and improved search capabilities
  • Visualisation control improvements including conditional show/hide in pivot tables and customisable master measures

Improvements In The Qlik Management Console & Performance

The September release includes another customer requested, key enhancement: the ability to move multiple apps from stream to stream (removing any previous limitations from the Qlik Management Console.) Further, Qlik has made investments to improve performance and stability with upgrades to the open source front-end framework.

Enhanced Mapping

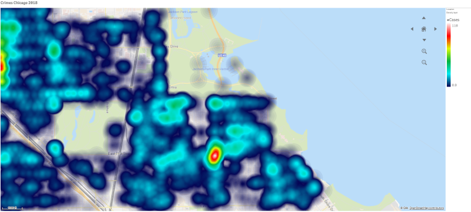
The September 2018 release will also deliver enhanced mapping capabilities, including a new multi-gradient Density Map Layer that is very useful when mapping data on a highly localised and detailed level. The Density Map Layer is a multi-colour gradient background where the colour intensity depends on the weight and closeness of points.  This map layer is useful for mapping data such as: crime statistics, house values, etc.  The release does not stop there with other general mapping improvements around additional controls and data inputs.

Connectivity

Connectivity has been continued with the addition of MS Azure DB and Jira connectors, while also delivering enhanced security with LDAP authentication to the integrated connector to Presto.

Enterprise Mobile Security

Mobile security requirements of large enterprise deployments are also addressed, delivering full support for AirWatch EMM, as AirWatch is among the fastest growing EMM vendors!

Strengthened Qlik NPrinting Reporting Capabilities

Qlik NPrinting is used for scheduled reporting.  Improvements have been made around administration, expanded authoring, and improved security for report consumption.  For example, you can now import users/roles from an LDAP source and, if desired, you can substitute the TLS Cipher suite.  In addition, Qlik NPrinting now has session expiration log out, output of reports in .xlsm formats, and report level password protection. 

To learn more about Qlik business analytics and how Qlik Sense may be applicable to your organisation, contact Inside Info.

How To Use Data Analytics To Recruit Top Australian Talent

Data Analytics & HR Analytics is the future of talent aquisition in Australia

"As companies turn their attention to growth and profitability, every hire should demonstrate measurable results towards the company's development and strategic goals, making the task of sourcing the right talent a priority for HR directors."

This quote comes from Robert Half's David Jones, speaking about a report that found 10% of Australia's employee turnover can be attributed to poor hiring decisions. The report also found that these decisions then have knock-on effects on productivity, staff morale and the company's bottom line.

Stop making poor hiring decisions in your organisation by getting smarter with your recruitment choices. Business analytics for recruitment can help you more intelligently gather and vet candidates, increasing your chances of making the right decision.

But how do you use data analytics for talent acquisition? Let's discuss.

How well are you using #HR #analytics to drive business outcomes?https://t.co/Y62EQISlEd pic.twitter.com/2nkrOKWCWh

— Inside Info (@insideinfoaus) August 3, 2017

Defining a good analytics strategy

Data is just numbers if you don't know how to use it. A smart HR analytics leader will have a realistic strategy underpinning their efforts, with key goals and milestones clearly laid out. Note our use of the word 'realistic' there, HR leaders often position themselves as 'strategic' without having an actual strategy in place. Using data analytics does not qualify as strategic on its own.

A smart HR analytics leader will have a realistic strategy underpinning their efforts.

So what is a good HR analytics strategy?

First, figure out what key business problems you need to solve. In some businesses, retention may be the issue. In others, it could be hiring under-skilled employees, or not finding the right candidates. This is your goal.

Then you can define what steps must be taken to solve this problem. For example, to improve retention, you may need to identify reasons for attrition, compare your business to competitors, and gather a list of metrics you can use to measure the impact of your recruitment data initiative. Perhaps these metrics will include turnover rates, salary figures, employee satisfaction levels and similar. Once you understand these steps you can begin to achieve them. These are your milestones.

When your milestones are rolling and you're sailing towards defined goals, your use of HR analytics is strategic.

Specific ways to use big data in talent acquisition

Ultimately, HR analytics can be used for any number of recruitment-related problems. So long as you have a clear goal and a series of milestones, you're positioning yourself in a situation where you can get results.

The following are examples of ways you can use data to solve talent issues that are common in the recruitment industry. Do any of these apply to your business?

When Xerox vetted its candidates using evidence-based data, it cut attrition rates by 20%.

1. Vetting candidates

HR data can be used to create a picture of the 'ideal employee' so you can turn that picture into a set of guidelines when hiring. This can help ensure employees don't leave at the first sign of a better deal, reducing attrition rates and easing pressure on the bottom line. To use a small case study, when Xerox started vetting its candidates using evidence-based big data, it cut its call centre attrition rate by 20%.

Vetting candidates using HR data analytics requires a few steps:

  1. Use evidence to create the perfect employee: Using the various metrics associated with your company's staff and their performance, try to determine who has so far proven to be the perfect employee. Record all data if it seems even slightly relevant - it's better to have too much rather than too little data.
  2. Factor changing business requirements: Now determine whether the business has changed since hiring these individuals. For example, perhaps some of your best staff were hired when the company was smaller so they achieved promotion much quicker than they would now. Try to use more recent data to avoid this problem if it becomes prevalent.
  3. Optimise your recruitment sources: This involves streamlining your recruitment pipeline. We discuss this point in greater detail below.
  4. Create a list of skills/attributes that are linked to success: By compiling the above data with past staff CVs and even interviewing key staff members, you can create a list of ideal skills and attributes that are linked to success. When you start recruiting for new hires, you can then compare candidates to the list to gauge if they are right or not.
  5. Identify potential promotions: While you're creating lists and checking on current employees, keep your mind open to the idea that the perfect candidate may already be a staff member. Use your newfound data to compare existing staff with requirements for other roles and see if a promotion would be a better idea than a new hire.

2. Optimising the recruitment pipeline

Your recruitment sources and processes are as important as your picture of the perfect employee. These are some ways you can use HR data to optimise your recruitment process, each of which can lead to faster lead times and less cost-per-hire:

  1. Identify where conversions are low: If you can quantify where candidate applications are slowing down or dropping out, you can begin to make adjustments. For example, you might choose to ask different questions on the application page, call for a different range of stats, offer more flexibility in salary negotiations, or even make it a point to offer contracts sooner than your current process.
  2. Optimise your recruitment sources: With data, you can tell which recruitment sources (job boards, LinkedIn, etc) perform best and worst. If any are underperforming, consider cutting them (unless you can objectively identify why they are underperforming, in which case you should patch them up before making cuts).
  3. Offer personalisation: Recruiters with large databases of candidates on file can use data to personalise job offers to these individuals. If you know what skills you require, and you compare these to the skills on offer from candidates, you can quickly find potential applicants, offer a personal message, and draw them into the pipeline.

Consider Inside Info for your data

Inside Info is one of Australia's top providers of Qlik software recognised as a Leader in business analytics by key industry analyst Gartner, recognised for its simplicity and effectiveness. Qlik can cover all of your data needs, from self-serve analytics dashboards to advanced metrics for predictive purposes. To find out more contact us today.

How Retailers Can Use Analytics & Personalisation To Satisfy Empowered Customers

Australian consumers are empowered consumers, and local retailers must satisfy them with personalisation to keep up.

Do you remember Coca Cola’s ‘Share a Coke’ campaign a few years ago? It featured personalised labels, so you could buy a bottle which – literally – had your name on it.  It was a massive success – in Australia in that first summer of its launch, Coke sold more than 250 million named bottles and cans in a nation of around 24 million people, then the campaign went global boosting sales in the US for the first time in over a decade. 

Although this is an early and relatively unsophisticated example of personalisation, it was highly rewarding for the brand.  Now, true personalisation using data analytics is the next big thing in Australian retail to satisfy empowered customers.  Emotional connections with consumers will become a point of competitive difference for retailers and engagement strategies that use business analytics smartly, will provide the foundation for growth.

The following are three ways in which you - using the power of data analytics - can start to leverage these personal connections using data you may already collect.

Tip 1: The Key To Personalised Shopping Is Learning Your Customer's Preferences Based On Their Behaviour

Adopting effective advanced business intelligence tools in order to accurately record and track over time customer purchase histories and business interactions is critical. Do people buy or browse certain goods more than others? Do they prefer to purchase items at certain times of the day or year, or more likely to purchase with other associated products or at certain price points? This is where advanced analytics comes in.

According to a report from Accenture in its Personalisation Pulse Check, 75% of consumers are more likely to buy from a retailer that recognises them by name, recommends options based on past purchases or knows their preferences.  It goes without saying that online retailers are well suited to offer personalised products and offers using data analytics and artificial intelligence, however this should be extended to include all retail channels.  Those physical retailers that also have an online presence and can integrate their data from all sources have a head start.

75% of consumers are more likely to buy from a retailer that recognises them by name, recommends options based on past purchases or knows their preferences.

Amazon Go takes this to a whole other level.  Retailers have been analysing market-basket purchases for many years now whilst continually trying to understand product shelf availability. But by taking advantage of IoT capability such as sensors, digital cameras and mobile technology, the industry is ready to uncover a much deeper level of insight.  Once you've got that data, we can work with Qlik's visual analytics platform to enable this IoT data to be associated with other traditional data sources, to help discover new insights into shopping behaviour. 

Brands today have a responsibility to make it easy for customers to engage, buy and consume what they want, how and when they want. The availability of data and digital technology today allows for a deeper level of personalisation needed to dynamically create experiences to each individual and context, across marketing, shopping, and services interactions. Yet many brands are still grappling with delivering upon customers’ desire for more personalised experiences. They create unintended barriers, such as too many options thrown at them or irrelevant recommendations.   In an era when your brand is the experience, it’s imperative that retailers deliver the ultimate user-friendly and tailored experiences or risk sacrificing sales and loyalty.

Tip 2: Create Personalised & Location-Based Offers

All too often, retailers are missing an opportunity by handing out blanket promotions.  Bringing together the online and offline environments as part of an integrated campaign can be highly successful. Using data from their online shopping, customers can be encouraged to visit the store with an email offering a relevant, personalised promotion. If a customer’s multi -channel buying history is available to stores at point of sale, then the retailer can see they are a loyal customer, even though it may be their first time in the store – and provide some kind of incentive such as a gift or discount.

There are a number of ways that traditional in-store retailers can respond to the increased demand by consumers for a more personalised approach, through the use of coupons or recommendations, for example. In an ideal situation, retailers should be able to rely on the power of real-time (weather, local events, competitor offers) at the point of sale to not only deliver customised offers, but do it both quickly and effectively.

Or related content based on items in the basket– ‘watch this YouTube video on how to pair the ingredients in your basket with wine’ could help enhance the customer experience. With the strong growth forecast by Planet Retail’s research in using click and collect services down the track from 35% to 76% of all shoppers - that is purchasing online and picking up in-store - it is important to ensure data is captured and analysed to understand behaviours exhibited through all interactions wherever they may be, so experiences can be integrated across the entire customer journey.

Tip 3: Build Better Customer Loyalty

The idea of personalisation remains key to future, sustainable success. Brand loyalty is largely an emotional matter. If a customer feels a retail brand understands their needs and lifestyle, they will remain loyal. It’s also a practical issue. Time-poor customers prefer to buy from a retailer they can rely upon, where they know they will find something they like and will suit them as individuals.

Many retailers are already on the road to customer engagement by creating tailored loyalty schemes and are able to gain data-yielded insights to boost the knowledge they have about their customers. This leads to better engagement, retention and long-term loyalty.  This is important, as Aberdeen Group’s Omni-Channel Customer Care research report suggests that brands with strong omni-channel engagement have an average retention rate of 89% versus 33% for brands with weak engagement.  That means businesses that excel in engaging customers across channels—including web, mobile, social media and in-store—retain more than twice as many customers as those without effective cross-channel customer care strategies. Key to this is regular training of customer service agents, managing miscommunication errors effectively and of course, effective management of customer data across channels. 

Again, it’s not that easy. With some loyalty schemes, it can take months before a retailer can actually build an accurate picture of the customer and be in a position to send tailored communications and offers. This lack of speed and agility can have a negative impact on overall engagement.

How To Adopt Data Analytics In Your Business

Inside Info has been working with retailers like APG for years in helping them easily consolidate data from multiple data sources (whether ERP, POS, CRM or warehouse systems), even coupling with contextual 3rd party data, to deliver dashboards and applications based on the leading Qlik business intelligence software platform that improve customer engagement, enable personalised customer experiences and communications and lift the bottom line.

When it comes down to it, personalisation comes back to improving the customer journey and improving their experience. It’s also a way for retailers to differentiate their service, reward loyal customers and build a more sustainable business.  To learn more about how Qlik business analytics can help and how it applies to retail you can download this new ebook Retail’s New Frontier - Visual Analytics. 

Download ebook


Is Blockchain The Future Of Data Analytics In Australia?

Is blockchain the future of data analytics in Australia?

"Blockchain will be more disruptive than electricity."

This quote comes from Jeff Schumacher of BCG Digital Ventures, and sums up the current mood about this digital technology. Blockchain has the power to reshape civilisation, from how we exchange currency (where the tech originated, which we'll get to in a moment) to how we gather, protect and consume digital information.

Which leads us to our big question: How will blockchain revolutionise big data, if at all? We discuss some basics about blockchain in the Australian context - which was a key talking point at the recent CFO Edge event - and the ways we believe it will benefit business intelligence.

What Is Blockchain?

Blockchain is the underlying technology behind cryptocurrencies like Bitcoin and Ethereum.

It's like a digital ledger - information is written into a single "block", and when that block is finished, it moves into the "chain". The chain is accessible by anyone, anywhere, and every single access point holds the same information. Essentially, this makes it theoretically unhackable: If you try to modify a block in London, it won't match up with the same information stored in Sydney, New York or Shanghai, so the modification won't get into the chain.

To learn more, check out this animation from the World Economic Forum:


Blockchain In Australia

Australia is a nation leading the way in blockchain use, although the road ahead is still long.

The ASX, for example, is trialling the use of blockchain as a replacement for its existing CHESS system. The idea here is that by using digital ledger tech (DLT), there would be greater record keeping in the post-trade equities market, as well as faster transactions and better-quality data.

Treasurer Scott Morrison believes that blockchain could have "significant productivity, security and efficiency gains" for Australia, and has been championing blockchain research. Now a raft of organisations are involved with DLT in some capacity, including CSIRO, Westpac, CommBank, BHP Billiton and the World Wildlife Fund.


The Relationship Between Blockchain And Big Data

For big data to be effective, companies must gather vast quantities of information, store it, and be able to not only access, but also distill it into legible insights. While this is where Hadoop alongside software such as Qlik have greatly helped the industry, blockchain could improve on some of the same principles.

These are the benefits some analysts believe blockchain will provide to the big data sector:

Greater data integrity

Hadoop is already somewhat decentralised, but blockchain takes this to a much further extreme. Theoretically, if a multinational corporation used blockchain for its big data, it could store information from every location in servers around the globe, and no two servers would contradict each other. C-suite execs would have access to insights that span their entire global network, without concern that the data in their location was out of date compared to, say, a server in another country.

Easier to control

In the same way as the point above, a decentralised platform makes data easier to maintain and control. System admins in each location have access to a single node, but that node gives them visibility across the entire chain. If one system goes down or, in an extreme situation, it is compromised, the information cannot be modified because it would contradict the other nodes.

Easier to audit

Blocks are written into the chain in chronological order, and each action has a digital signature stamped into it. Theoretically, this would make the trail of information from source through to storage easy to track and audit, because a detailed history will always exist.

Examples Of Blockchain In Use

Let's look at how blockchain-based big data could help two very different Australian sectors: Fintech and healthcare.

Fintech

Because DLT records absolutely everything, financial analysts could potentially mine customer transactions in real time. They could learn spending habits in detail, or more importantly, track patterns using analytics and detect fraud as it occurs. This, of course, sparks a number of privacy concerns, but the industry is burgeoning and guidelines will no doubt evolve as does the tech.

Healthcare

Getting data wrong in healthcare could cost somebody their life. Blockchain can provide a number of data guarantees that doctors and healthcare administrators could use to better learn about their patients and, subsequently, provide better care. Customer records would be secure, highly accurate, and be accessible by multiple different providers - the latter helping calm the fear that important information would be lost in transit.

In Conclusion

Blockchain is not a magic solution for Australian businesses looking to invest in big data - not yet, anyway. There are still a number of privacy and security concerns, not to mention cost implications relating to a need for entirely new infrastructures, but it's all developing at a rapid rate.

For now, local businesses can turn to existing platforms to get fast, accurate insights on their big data. And that's where Inside Info comes in: We can provide some of the best business intelligence software in Australia, for mid-market and large enterprises. 

Pages